There are a few options to add charts to your Thymeleaf application, but one of the easiest is to integrate Google Charts. They are powerful, simple to use and free. This blog post will show how we can integrate them into a Thymeleaf/Spring Boot application.
There are many types of charts available in Google Charts. We will use a simple bar chart to demonstrate the integration, but the same principles apply to any of the other charts that are available.
Project setup
Create a project on https://start.spring.io with the Thymeleaf and Spring Web dependencies selected (or use this direct link).
Add a controller:
import org.springframework.stereotype.Controller;
import org.springframework.web.bind.annotation.GetMapping;
import org.springframework.web.bind.annotation.RequestMapping;

@Controller
@RequestMapping("/")
public class RootController {

    @GetMapping
    public String index() {
        return "index";
    }
}
And an index.html in src/main/resources/templates:
<!DOCTYPE html>
<html lang="en">
<head>
<meta charset="UTF-8">
<title>Google Charts With Thymeleaf</title>
<!--Load the AJAX API-->
<script type="text/javascript" src="https://www.gstatic.com/charts/loader.js"></script>
<script type="text/javascript">
// Load the Visualization API and the corechart package.
google.charts.load('current', {'packages':['corechart']});
// Set a callback to run when the Google Visualization API is loaded.
google.charts.setOnLoadCallback(drawChart);
// Callback that creates and populates a data table,
// instantiates the pie chart, passes in the data and
// draws it.
function drawChart() {
// Create the data table.
var data = new google.visualization.DataTable();
data.addColumn('string', 'Topping');
data.addColumn('number', 'Slices');
data.addRows([
['Mushrooms', 3],
['Onions', 1],
['Olives', 1],
['Zucchini', 1],
['Pepperoni', 2]
]);
// Set chart options
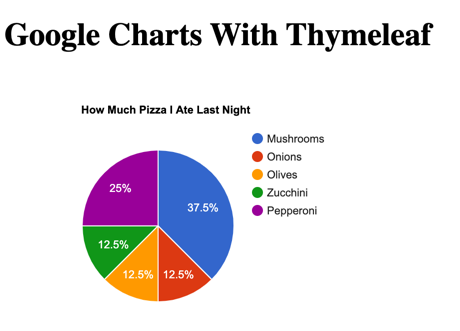
var options = {'title':'How Much Pizza I Ate Last Night',
'width':400,
'height':300};
// Instantiate and draw our chart, passing in some options.
var chart = new google.visualization.PieChart(document.getElementById('chart_div'));
chart.draw(data, options);
}
</script>
</head>
<body>
<h1>Google Charts With Thymeleaf</h1>
<div id="chart_div"></div> (1)
</body>
</html>| 1 | The chart will be rendered here |
We are using the example from the Google Charts documentation here.
Start the Spring Boot application and access http://localhost:8080 in the browser. You should see something like this:
Get data from server
The data in the example is defined inside the JavaScript block:
data.addRows([
                ['Mushrooms', 3],
                ['Onions', 1],
                ['Olives', 1],
                ['Zucchini', 1],
                ['Pepperoni', 2]
            ]);
We want to get the data from our controller. In an actual application, we would inject a service bean into our controller to actually fetch the data. For this example, we will just randomly generate some data.
Update the RootController to put the data for the chart in the Model:
import org.springframework.stereotype.Controller;
import org.springframework.ui.Model;
import org.springframework.web.bind.annotation.GetMapping;
import org.springframework.web.bind.annotation.RequestMapping;

import java.util.List;
import java.util.Random;

@Controller
@RequestMapping("/")
public class RootController {
    private static final Random RANDOM = new Random(System.currentTimeMillis());

    @GetMapping
    public String index(Model model) { (1)
        model.addAttribute("chartData", getChartData()); (2)
        return "index";
    }

    private List<List<Object>> getChartData() { (3)
        return List.of(
                List.of("Mushrooms", RANDOM.nextInt(5)),
                List.of("Onions", RANDOM.nextInt(5)),
                List.of("Olives", RANDOM.nextInt(5)),
                List.of("Zucchini", RANDOM.nextInt(5)),
                List.of("Pepperoni", RANDOM.nextInt(5))
        );
    }
}| 1 | Add Model as a parameter to the controller method.
Spring will inject an instance automatically. |
| 2 | Add the data under the chartData key to the model. |
| 3 | Generate the random data for the chart.
Note how we create a List<List<Object>> because this is the format that the addRows() JavaScript method of the Google Charts library expects. |
Now that the controller returns the correct data, we can update the Thymeleaf template to use it:
<script type="text/javascript" th:inline="javascript"> (1)

        // Load the Visualization API and the corechart package.
        google.charts.load('current', {'packages':['corechart']});

        // Set a callback to run when the Google Visualization API is loaded.
        google.charts.setOnLoadCallback(drawChart);

        // Callback that creates and populates a data table,
        // instantiates the pie chart, passes in the data and
        // draws it.
        function drawChart() {

            // Create the data table.
            var data = new google.visualization.DataTable();
            data.addColumn('string', 'Topping');
            data.addColumn('number', 'Slices');
            data.addRows([[${chartData}]]); (2)

            // Set chart options
            var options = {'title':'How Much Pizza I Ate Last Night',
                'width':400,
                'height':300};

            // Instantiate and draw our chart, passing in some options.
            var chart = new google.visualization.PieChart(document.getElementById('chart_div'));
            chart.draw(data, options);
        }
</script>| 1 | Add the th:inline="javascript" attribute so that the inlined Thymeleaf variable is properly escaped for JavaScript. |
| 2 | Use [[${chartData}]] to have Thymeleaf put in the value of the chartData model key. |
Restart the application and refresh the webpage. You should see an updated chart on each refresh since we randomly generate the number of slices.
Iterating a Thymeleaf variable in JavaScript
If you look at the sources of the generated HTML in the browser, you will see something like this:
data.addRows([["Mushrooms",2],["Onions",0],["Olives",3],["Zucchini",3],["Pepperoni",0]]);All data is on 1 line. For this simple example, it does not matter too much, but for more complex data, the line might get very long and hard to debug if need be.
We can make the generated HTML a lot nicer with by iterating over the variable in JavaScript:
            var data = new google.visualization.DataTable();
            data.addColumn('string', 'Topping');
            data.addColumn('number', 'Slices');
            data.addRows([
                /*[# th:each="row : ${chartData}"]*/
                [[${row}]],
                /*[/]*/
            ]);
We declare a th:each and assign each row of data in the chartData variable to the row variable.
We then output the row with a trailing comma.
The result of this is that the generated HTML now looks like this:
            data.addRows([

                ["Mushrooms",4],
                ["Onions",2],
                ["Olives",3],
                ["Zucchini",3],
                ["Pepperoni",3], (1)

]);| 1 | JavaScript does not care about the trailing comma here. |
Each row of data is now on a separate line in the HTML.
Conclusion
Adding a Google Chart to your Thymeleaf application is not a lot of work. Just prepare the data in your controller and output it like the charting library wants it.
What are you using to draw charts with Spring Boot and Thymeleaf? Do let me know on Twitter!
The full sources of this example can be found on GitHub.